
Backtesting that does not lie
to yourself.
Every strategy "works" in an optimized backtest. The survival test is the antidote: if buying and selling at random times already loses money, your "edge" might just be luck.
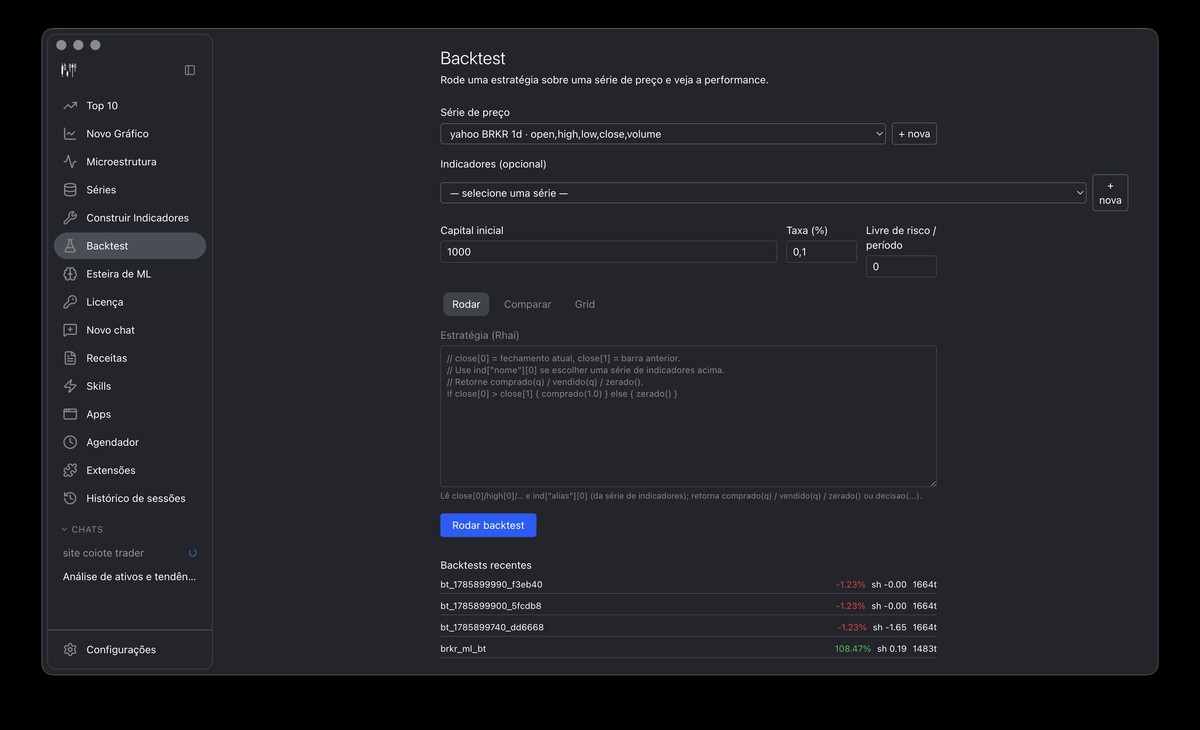
Verida — Rhai strategy, real metrics and equity curve
The method, step by step
Write the strategy in Rhai
Simple, typed, secure scripting language. Reads close[0], ind["rsi"][0], posicao. Returns comprado(), vendido(), zerado().
Run the backtest
The engine simulates execution bar by bar, with or without fees. Generates equity curve, complete metrics and trade list.
Survival test
The arbitrary-side test: fires long and short at N random moments with the same adaptive manager. If the net result is negative on either side, no reading can save it — it is overfitting. If Σ ≥ 0 without fees, the manager has a floor.
Metrics that matter
No marketing metrics. Each one has statistical meaning.
Sharpe Ratio
Risk-adjusted return. Industry standard.
Sortino Ratio
Like Sharpe, but only penalizes downside. More honest.
Max Drawdown
Largest drop from peak to valley. How much you lose in the worst moment.
Win Rate
Percentage of winning trades. Does not say everything — but says something.
Profit Factor
Gross gains / gross losses. More than 1 = profitable.
Total PnL
Accumulated profit/loss. The final number.
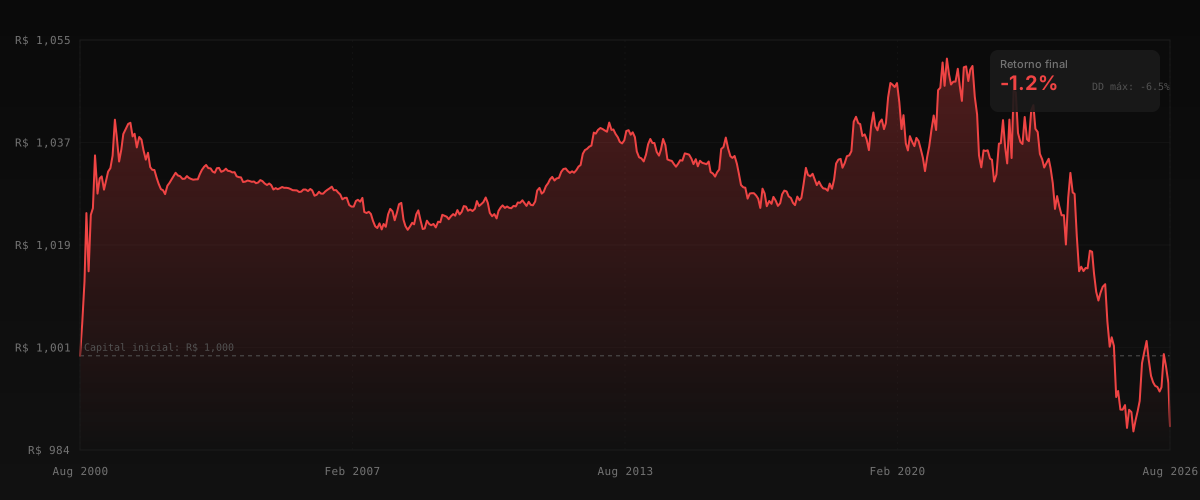
Real example: equity curve
Backtest of moving average crossover on BTCUSDT 1h, 6,537 bars (2000–2026). No miracles — and that is exactly the point.
"Survival before edge. If the setup does not survive the arbitrary side, there is no edge — there is overfitting disguised as alpha."
CT Doctrine — Phase 1: Foundation